Saturday, July 23, 2011

BI Lifecycle In 2 Hours? Day In The Life of a Solutions Architect

I just came out of a meeting with a prospective customer (not to be named).  Somewhat of a typical meeting with a group of relatively junior IT/BI professionals - all over the place.  The group did the typical beating of the chest about how tools they have today are so good.  Rapid fire questions from all angles quickly sabotage of any kind of flow or sequence that I had in mind for my presentation.  Quick on our feet... In the end it was all good.  They want to see more.

The challenge presented to me for the next meeting is to show them the 'Business Discovery' Development Life Cycle for QlikView.  ETL to Dashboard, Development/Reporting, Publishing of documents, etc.....  Oh, and make the app mobile!  Time allocated for our meeting 2 hours.  Now, some would sweat,  I winder... would the competition can even entertain such a meeting.


If you are familiar with QlikView and understand it is core capabilities well you know from a product perspective it is up to the challenge.  The plan of attack:
  
Keep the data model straightforward but still make it compelling for the customer.  One (no more than two) data sources.  Maybe 3 to 4 tables.  

Step 1: 40 minutes - Back End
  • Build a basic Star Schema
  • Have a Calendar script handy for time savings.
  • Show the evolution of the data model, adding one table at a time.  
    • Populate the main tab with some list boxes from each table - showing the data discovery power of QlikView - before an interface is even built.
  • Show some modest transformations to demonstrate the capabilities of the ETL functions.
  • Show the final Star Schema - speak to the associative model, etc...
 Step 2: 40 minutes - Front End
  • Layout a simple dashboard (2 tabs) - remember - clock is ticking
    • 1st Tab - Dashboard
    • 2nd Tab - Details
    • If you have time for a 3rd insert a tab in between the first 2 with some KPIs around a key dimension such as customer or product
  • Use a basic template - company colors are always a good idea if you can get them before hand (Tip - go to the client website and capture colors from their logo, etc..)
  • Be sure show 3 to 4 different types of visualizations, use of a mini-chart, gauge, bar/combo chart, possibly a scatter if the data accommodates it.
  • If you are doing a mobile demo be cognizant of the resolution you are using.
 Step 3: 30 minutes - Save & Publish
  • Save the document in a place that QlikView Server will see it
  • Setup a distribution (great if you can do a loop/reduce example)
  • Show app in the Access Point and how the end-user would see it.
  • Demo self-service.
  • Pull out your iPad.  Even better - have the customer use theirs! Demo mobile .
Step 4: 10 minute summary and next steps!   or.....Sign here _____________

    Thursday, April 14, 2011

    Mobile BI On IPad .....It Is No Longer Hype

    I have been working with QlikView a long time.  Longer than many in the community.  Those that know me know that I am also an early adopter.  So yes, I had QlikView on my iPhone within an hour of it being available in the App Store.  I quickly followed suit on the iPad, even tested QlikView on the Android while giving the EVO4G a test run from Sprint.

    With all of that testing and playing around (I use those terms purposefully) I was still really waiting for Mobile BI to take hold and start to gain traction in the business.  For a long time is was filled with ideas of what could be but the interface was not quite there yet.  

    It has become clear to me that within the past 6 months (maybe 4 months is more accurate) the hype of Mobile BI could be has passed and reality of what it has become is upon us!  Real mobile BI solutions are being sought out by industry leaders more than ever and now there is a platform for delivery of those solutions.

    Next week QlikView will release the Universal Touch Client as part of the latest service release in version 10 (SR2).  I have been using the beta for about a month and I am so impressed with the stability, usability, and ease of deploying useful Mobile BI apps.  Of course there has to be a down side.... here it is...

    As a QlikView partner my company makes a living on implementation services.  As an evangelist for QlikView I enjoy the countless conversations I have had over the past several weeks with my customers explaining how they leverage their existing investments in QlikView and deploy compelling applications in a truly mobile , touch based interface, quickly, easily, and ....for the most part free.   It is very exciting.  Customers are excited to know they have made an investment in a company that is bringing value to their organization in ways they never event considered when they first purchased QlikView.

    So, will I retire on the revenue from building mobile BI apps in QlikView for existing customer's?  Maybe not, but there a whole lot prospective clients that will find the allure of the QlikView on Mobile solutions we build for Life Sciences and Financial Services that we are happy welcome to the B&D and QlikView community.  This is the hook that will finally land the big fish!

    Check out the latest on QlikView on Mobile!


    Saturday, April 2, 2011

    3rd Party App - Adds Flexibility For QlikView Report Distribution

    Recently I started to review NPrinting 10 for QlikView.  This 3rd party application allows you to distribute not only PDF QlikView Reports but also Excel Reports from your QlikView environment (from server or desktop editions).


    I spent about 30 minutes with the product and I was also able to get a good overview from the creators and I was impressed with its potential.  Especially the ability to dynamically filter data and distribute 'templated' Excel reports from visualizations in QlikView.


    As you may know QlikTech offers a PDF Report Distribution add-on to Publisher Enterprise that simply allows Publisher tasks to distribute QlikView Reports in PDF format.  There is no way to automate (short of macro development) the distribution of reports in Excel.  Also, the cost of this add-on makes it cost prohibitive unless you are distributing to a very large group of people.  NPrinting has the potential to give users a more cost effective entry point into PDF distribution with the added benefit of doing Excel distribution as well.


    See for yourself.... http://www.nprinting.com/

    I will post a more detailed review once I spend a bit more time with the product.

    /emb

    Monday, January 17, 2011

    Meta Tags in QlikVIew 10

    One of the more talked about features missing in prior versions of QlikView is the ability to store Meta Data within a QlikView application.  Short of the 'Help Text' in prior versions there were not a lot of options (you could include a data source with descriptive information on table structures/fields) prior to version 10 but this was more of a work around).


    In QlikView v10 there are more choices for setting up Meta Data tags in the QlikView interface and the script. I will walk through a few different examples of the available features below:


    Expression Comments:
    When using the chart wizard there is a new Expression Comment box within the Expressions tab.  Here you can enter comments or select meta data from a data source to tag some basic commentary about a particular expression.


    Comment Field Highlighted in Yellow
    Consider the image to the right.  Here my expression is expressed in a variable that could have easily introduced into my application from a data source (a repository of expressions).  I am describing the what my variable '$(vGoals)' means using plain text.  I can also read this from the same data source as the expression itself allowing for meta data regarding expressions to be maintained outside of my QlikView application and leveraged across many applications.


    Document Properties/Tables:
    When you view the Document Properties (Tables Tab) in QlikVIew 10 there is a new option ('Edit Tags') when you highlight a field with the field list. 
    Edit Tags within Document Properties/Tables Tab
    Looking at the image to the left, I selected the field 'G' and selected the Edit Tag button in the footer.  A new Edit Tags dialog box appeared where I selected 'Add' to add additional Meta Data to this field.


    There is no limit to the number of tags that can be added here.  You will also noticed that there some existing Meta Data provided by QlikView on the type of field. In this case we can see that the field 'G' is numeric and is of the type integer.


    Table Viewer - Mouse Over Field
    Once I add my own set of tags you can see these tags show in the table viewer when you mouse over the field name.  In my example to the right you can see 'Goals Scored By Player' and 'Puck Goes In The Net' as an example of descriptive tags entered in the interface above.


    Adding Tags in the Script:
    Meta Tags can be added via the script using a Mapping Load and the Tag Function.  Using the same example above I have an external source that has the field names and some meta data descriptions.  Using the script sample below I can load the Meta Data using a Mapping Load in conjunction with the Tag command:
    Use of Mapping Load and the TAG Function

    The Tag function provides a way of assigning tags to a field. Field names not present in the document are ignored. If conflicting occurrences of a field or tag name are found, the last value is used.
    A field tagged with dimension will be displayed at the top of all field selection controls in QlikView except in the Edit Expression dialog.
    A field tagged with measure will be displayed at the top of all field selection controls in the Edit Expression dialog.  Examples of where these tags display are below:


    Table Viewer
    Select Fields Dialog
    Chart Wizard
    These new features are welcome additions to QlikView in helping you better track Meta Data in your QlikView applications.  Your users will appreciate the added value of having Meta Data descriptors when trying to enhance their QlikView applications.

    /emb

    Sunday, November 28, 2010

    Container vs. Fast Change - QlikView 10 Feature More Intuitive

    In my last post (some time ago) I reviewed some new feature highlights from the latest release of QlikView.  One of the features, the Container object is quickly changing my thoughts about using the traditional 'Fast Change' feature.


    For as long as I can remember you have had 
    the ability to have a QlikView chart object quickly morph from straight table to bar chart, to pie chart, etc... with the use of the Fast Change Feature.  


    This feature allowed the user to select a small caption icon (or embedded icon within the chart) to rotate through different chart types with the same data. A 'fast change' of the way the user could view that particular set of data.


    Over the years I found that most end users do not take advantage of this feature.  They often simply just forget about the fact they can get a different view of the data (in my mind because the icon for fast change is so subtle).  Also, there are some limitations using the Fast Change feature with the straight table and pivot table chart types (if you choose to suppress the caption). 


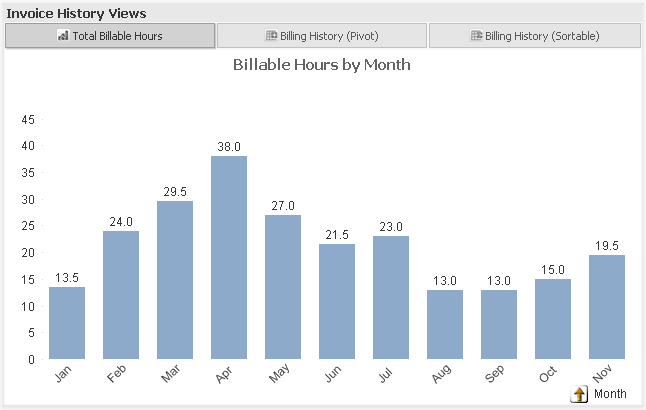
    In my opinion, I believe the new Container Object in QlikView 10 really supplants the need for the Fast Change feature.  Using a container you can have a more 'in your face' layout so the user can see the different way of viewing similar data.  In the example container object (left & below) the container gives  you more flexibility to leverage caption text or title text to show the differences in the views.  


    All three of these example images come from the same container object.  You can see that tabs (at the top) display the title of the chart (2 charts have no caption and 1 still has the caption). Having that tabs allows for a more literal description of how a chart might be used making it very clear for the user on how to use the chart (sortable/pivot).  Suppressing the caption adds more real estate for your chart and the container object still displays a proper title in the tab labels for each chart.


    The next time you have the need to show multiple views of the same data consider using the Container Object instead of the Fast Change.  I think your users will embrace it!


    If you decide to use the Container Object I recommend that once you place your charts in the Container that you relocate the original charts to a hidden sheet to conserve the screen real estate and to avoid confusing the end user with too many minimized charts on the same sheet.


    /emb

    Thursday, October 21, 2010

    QlikVIew 10 Highlights

    There are many great new features in the latest release of QlikView.  This release focused on some key improvements in the area of development and usability as well as the enterprise manageability.


    I thought I would highlight just a few of the improvements in this post.


    Syntax Checking
    I have been using QlikView a long time (I think my first experience was with version 4). But those who know me understand that I come from the operations side of IT and those roots were not based in software development.  So, you can imagine my delight when QlikTech added syntax checking in QV 10!


    The red underline that highlights misspellings has become ubiquitous in just about all programs (Word, Web based editors, etc...).  QlikView now takes advantage of the common red underline metaphor to help identify syntax mishaps.  This saves developers a lot of time by alerting them to problems prior to an attempted reload or debug load.  (As I typed this I saw that friendly red line about 3 or 4 times)!


    Old Method (before v10):                                       New Method (v10):
                                                    
    You can see above that in V10 everything after my syntax error (missing comma) is underlined in red.  This is a slightly different than Microsoft Word underling the actual misspelling.  In this case the culprit is something that is missing so I think the logic of showing an red line after the syntax error is good approach.  (I am thankful for any help I can get)  :-)


    Linked Objects
    When it comes to QlikView I enjoy the graphical dashboard design process the most (you probably guessed that based on my love for syntax checking - coding is not my favorite). Another great improvement for the developer and some power usesr is the concept of object linking.


    Consider objects that are displayed consistently on multiple sheets within a dashboard (Current Selections Box, High Level Dimensions such as Region or Division come to mind).  Prior to v10 if you changed an attribute on one of these objects you would have to repeat that across all sheets.  The includes moving an object a pixel or two in any direction, color, caption settings, fonts, etc...  If you are a perfectionist this can be tedious or you do a lot of cut / copy / past each time you make a significant change on one sheet.


    With Linked Objects you can link common objects across sheets so that a change in an object on one sheet replicates to all other linked objects!


    Sample Sheet:
    Consider the List Boxes on the left of Sheet 1 in my Sample Sheet to the left.  I can now copy (using CTRL-SHIFT and drag) to another sheet and link the 2 objects together.  When you copy you will see the link icon represented during the process 
    Now when you right click on the List Box a new Linked Object menu is available.  After you make a change to the object you can select the option to carry that change across all linked objects.  This will prove to be a real time saver during the design process.

    Container Object
    One of the new object types in v10 is the container object.  It is a very generic component that allows you to 'group' objects together.  They can be any type of objects, charts, list boxes, multi-boxes, text boxes, etc...  This can be very useful in grouping common objects together and maximizing real estate on your dashboard.

    Consider the sample sheet to the left.  This is a pretty basic example because there are only 2 charts open and 2 additional chart minimized.  If I wanted to maximize real estate I can use some traditional methods (auto-minimize, actions, macros, etc...). In v10 have a new option to group like charts or objects in a common container making it easier for the user to scroll through the objects within the container.  
    Instead of double-clicking on the minimized charts to view them I can simply single click through my container by selecting the objects down the left margin of my container (this is configurable).  I have 4 charts sharing the same real estate without a lot of over engineering of the layout of each chart.
    There are many more exciting features in Qlikview 10.  I will highlight more in future postings.

    -emb


    Tuesday, October 12, 2010

    QlikView Blog Post 'As Easy As Your Favorite Consumer App'

    Following up on my last post on QlikView 10 Associative Search there has been a helpful video published to show you how easy it really is....

    QlikCommunity As Easy As Your Favorite Consumer App - The QlikView Blog