

the ability to have a QlikView chart object quickly morph from straight table to bar chart, to pie chart, etc... with the use of the Fast Change Feature.

Over the years I found that most end users do not take advantage of this feature. They often simply just forget about the fact they can get a different view of the data (in my mind because the icon for fast change is so subtle). Also, there are some limitations using the Fast Change feature with the straight table and pivot table chart types (if you choose to suppress the caption).

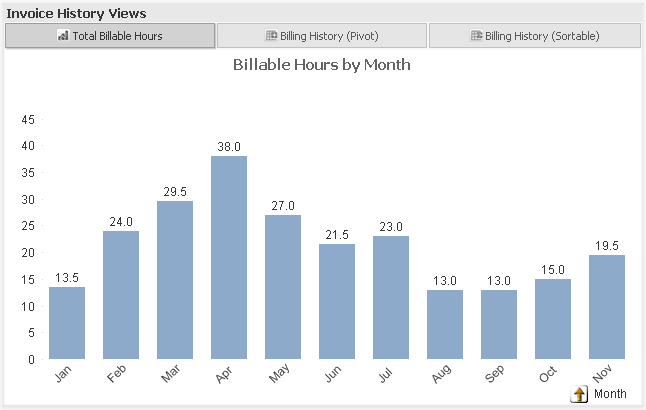 All three of these example images come from the same container object. You can see that tabs (at the top) display the title of the chart (2 charts have no caption and 1 still has the caption). Having that tabs allows for a more literal description of how a chart might be used making it very clear for the user on how to use the chart (sortable/pivot). Suppressing the caption adds more real estate for your chart and the container object still displays a proper title in the tab labels for each chart.
The next time you have the need to show multiple views of the same data consider using the Container Object instead of the Fast Change. I think your users will embrace it!
If you decide to use the Container Object I recommend that once you place your charts in the Container that you relocate the original charts to a hidden sheet to conserve the screen real estate and to avoid confusing the end user with too many minimized charts on the same sheet.

/emb
Nicely explained!
ReplyDeleteVery useful information thanks for sharing Qlickview Online Training
ReplyDeletevery nice information Data Scientist online
ReplyDeleteThank you so much for providing information and producing results that are really useful to prove useful for QlikView.
ReplyDeleteQlik Soap API Connection