Sunday, November 28, 2010

Container vs. Fast Change - QlikView 10 Feature More Intuitive

In my last post (some time ago) I reviewed some new feature highlights from the latest release of QlikView.  One of the features, the Container object is quickly changing my thoughts about using the traditional 'Fast Change' feature.


For as long as I can remember you have had 
the ability to have a QlikView chart object quickly morph from straight table to bar chart, to pie chart, etc... with the use of the Fast Change Feature.  


This feature allowed the user to select a small caption icon (or embedded icon within the chart) to rotate through different chart types with the same data. A 'fast change' of the way the user could view that particular set of data.


Over the years I found that most end users do not take advantage of this feature.  They often simply just forget about the fact they can get a different view of the data (in my mind because the icon for fast change is so subtle).  Also, there are some limitations using the Fast Change feature with the straight table and pivot table chart types (if you choose to suppress the caption). 


In my opinion, I believe the new Container Object in QlikView 10 really supplants the need for the Fast Change feature.  Using a container you can have a more 'in your face' layout so the user can see the different way of viewing similar data.  In the example container object (left & below) the container gives  you more flexibility to leverage caption text or title text to show the differences in the views.  


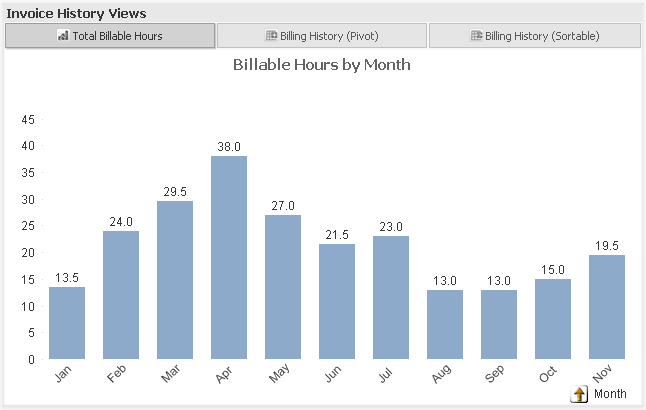
All three of these example images come from the same container object.  You can see that tabs (at the top) display the title of the chart (2 charts have no caption and 1 still has the caption). Having that tabs allows for a more literal description of how a chart might be used making it very clear for the user on how to use the chart (sortable/pivot).  Suppressing the caption adds more real estate for your chart and the container object still displays a proper title in the tab labels for each chart.


The next time you have the need to show multiple views of the same data consider using the Container Object instead of the Fast Change.  I think your users will embrace it!


If you decide to use the Container Object I recommend that once you place your charts in the Container that you relocate the original charts to a hidden sheet to conserve the screen real estate and to avoid confusing the end user with too many minimized charts on the same sheet.


/emb

Thursday, October 21, 2010

QlikVIew 10 Highlights

There are many great new features in the latest release of QlikView.  This release focused on some key improvements in the area of development and usability as well as the enterprise manageability.


I thought I would highlight just a few of the improvements in this post.


Syntax Checking
I have been using QlikView a long time (I think my first experience was with version 4). But those who know me understand that I come from the operations side of IT and those roots were not based in software development.  So, you can imagine my delight when QlikTech added syntax checking in QV 10!


The red underline that highlights misspellings has become ubiquitous in just about all programs (Word, Web based editors, etc...).  QlikView now takes advantage of the common red underline metaphor to help identify syntax mishaps.  This saves developers a lot of time by alerting them to problems prior to an attempted reload or debug load.  (As I typed this I saw that friendly red line about 3 or 4 times)!


Old Method (before v10):                                       New Method (v10):
                                                
You can see above that in V10 everything after my syntax error (missing comma) is underlined in red.  This is a slightly different than Microsoft Word underling the actual misspelling.  In this case the culprit is something that is missing so I think the logic of showing an red line after the syntax error is good approach.  (I am thankful for any help I can get)  :-)


Linked Objects
When it comes to QlikView I enjoy the graphical dashboard design process the most (you probably guessed that based on my love for syntax checking - coding is not my favorite). Another great improvement for the developer and some power usesr is the concept of object linking.


Consider objects that are displayed consistently on multiple sheets within a dashboard (Current Selections Box, High Level Dimensions such as Region or Division come to mind).  Prior to v10 if you changed an attribute on one of these objects you would have to repeat that across all sheets.  The includes moving an object a pixel or two in any direction, color, caption settings, fonts, etc...  If you are a perfectionist this can be tedious or you do a lot of cut / copy / past each time you make a significant change on one sheet.


With Linked Objects you can link common objects across sheets so that a change in an object on one sheet replicates to all other linked objects!


Sample Sheet:
Consider the List Boxes on the left of Sheet 1 in my Sample Sheet to the left.  I can now copy (using CTRL-SHIFT and drag) to another sheet and link the 2 objects together.  When you copy you will see the link icon represented during the process 
Now when you right click on the List Box a new Linked Object menu is available.  After you make a change to the object you can select the option to carry that change across all linked objects.  This will prove to be a real time saver during the design process.

Container Object
One of the new object types in v10 is the container object.  It is a very generic component that allows you to 'group' objects together.  They can be any type of objects, charts, list boxes, multi-boxes, text boxes, etc...  This can be very useful in grouping common objects together and maximizing real estate on your dashboard.

Consider the sample sheet to the left.  This is a pretty basic example because there are only 2 charts open and 2 additional chart minimized.  If I wanted to maximize real estate I can use some traditional methods (auto-minimize, actions, macros, etc...). In v10 have a new option to group like charts or objects in a common container making it easier for the user to scroll through the objects within the container.  
Instead of double-clicking on the minimized charts to view them I can simply single click through my container by selecting the objects down the left margin of my container (this is configurable).  I have 4 charts sharing the same real estate without a lot of over engineering of the layout of each chart.
There are many more exciting features in Qlikview 10.  I will highlight more in future postings.

-emb


Tuesday, October 12, 2010

QlikView Blog Post 'As Easy As Your Favorite Consumer App'

Following up on my last post on QlikView 10 Associative Search there has been a helpful video published to show you how easy it really is....

QlikCommunity As Easy As Your Favorite Consumer App - The QlikView Blog

Tuesday, September 28, 2010

Associative Search in QlikView v10

One of the great new features in QlikView 10 is the idea of extending the concept of the associate data model.  The embedded search tool now supports the idea of Associative Search.


Click Search Icon In Caption
When you click on the search icon with in the caption of the list box a new 'chevron appears'.  A chevron pointing to the right searches on the field value in your list box.  


Right Pointing Chevron


If you click on this chevron it will change directions and expand the search box (see image to the below/center).


In v10 when you enter a search term in this box you are no longer just searching the field value within the list box but rather searching other field values that may be associated with the values within the list box. 


For example,  If I am on the Customer Name list box I can use other criteria associated with the customer to try and narrow the list of customer names.  Examples could include: a product they may have purchased, a telephone number, a street name, a sales person, etc...


As you enter a search and select a value QlikView will build a list, allowing you to search on many different terms before limiting your data set.  For example:


In the above associative search I entered a product (and selected with a mouse click), then I searched for a month/year, and finally a state.  As I added selections the number of names in the customer list (on the left) grew smaller and smaller.  Finally after all three search terms I was left with 2 potential names.  I then hit 'enter' on the keyboard and I am left with these 2 customers selected:


Notice that while my 2 customer are selected, the search terms used in my associative search are not used to limit my data set.  You can tell this by the fact that I see more products than just the original 'Vest' item I used in my associative search.  


Take Away:
The take away from this feature is that you can use the power of the associative data model by searching for values associated with any entity in your data model without actually using them as 'filters' as we have come to know in QlikView.


-emb


Monday, September 27, 2010

Who owns BI in your company?

Who owns Business Intelligence?

This is almost seems like a silly (possibly stupid) question - The word business is even part of the question!  So... who owns it at your company?
Is it the 'business' (eg finance, sales, customer service) or folks within the information technology organization (IT)?  

Todays Symptoms:  IT has grown tired of users asking for new reports, 'cubes', charts, and/or visualizations, etc... and the business has reached a new level of frustration waiting for delivery of those requests, and the cost at which the come.  Maybe this can help settle the debate within your company.

How did we get here?:  In today's economy IT has been asked to do so much more with even less resources.  As business leaders are tasked to be more creative in improving the bottom line their requests for good information and analytics increases the burden on an already shrinking IT workforce.  Delivery cycles grow longer the business becomes impatient, Excel hell begins (aka spread-marts) as the business starts pulling together its own data, possible creating metrics and KPIs using sources that are not 'sanctioned' by IT.  Shadow IT efforts are on the rise, tempers flare when the numbers are inaccurate. We all know where it goes from there.

Argument for IT: The business folks often need to be reminded that there is good reason for IT to play a central role in delivering BI.  Data governance, regulatory control, security, they all play a role in why IT must be in the game.  

Argument for the business: On the other hand, for BI to be successful, it is imperative that BI be driven by the business. With any enterprise IT initiative - if the business is not involved in the design, the system will fail (or simply go unused).  

Let's face it, the questions asked by the business are ever changing.  We know that business leaders today most likely know the questions they will be asking tomorrow.  This is the challenge to the business as focus is continually changing under todays economical conditions and increased competition.  The information they get from the first report they received from IT leads to what seems like a set of endless possibilities on how they can measure the business.  With the rise of each new question more burden is put on the IT staff to deliver and deliver in a timely manner.

What is the right strategy in today's market?

In order to be successful we must satisfy the requirements of both IT and the Business.  This is best done by relying on IT for data provisioning and the business for analytics and reporting.

This dichotomy insures that the business is using data that has passed the checks and balances of a sound data governance strategy (yes - I am making an assumption that there is a data governance strategy in place).  This strategy can mean vary in its complexity from company to company (data stewardship, data quality, meta data management, etc...).  Allowing the business to own the development of analytics and reporting insures the they have proper control over the speed in which they can deliver that analysis and information to decision makers.  The business can then deploy tools that are designed for rapid development and deployment - without the wait for costly IT development cycles. 

It seems so simple when you put it on paper.  In many of today's enterprise companies there are significant walls that need to be torn down to facilitate this collaborative approach to BI.  One way to help deliver this kind of value is to embrace the concept of a  BI Center of Competency (BICC) to oversee the process.  The BICC is sponsored by the business with support from IT, insuring that the concepts of data governance, security, and controls are well defined.  More on BICC in a future post (stay tuned).

-emb

Tuesday, September 21, 2010

B&D / QlikView - Positioned For Success

I am pleased to be writing this first blog entry, having recently joined Business & Decision (B&D) in their Business Intelligence practice in North America.  


B&D is a global consultancy with offices in 18 countries, 2800 consultants (200 in the US), and over 300 million in revenue (65% coming from the BI practice). 


I am very excited to take on my new role as a Sr. Solutions Architect focused on growing our QlikView practice in North America. We are in a very good position to leverage our collective experience implementing enterprise BI solutions on a global scale.  Whether it is  BI Competency Center (BICC) development, ERP integration, or a comprehensive data governance strategy we can add significant value to QlikView deployments within the enterprise.


Over the course of the last 10 years I have had the good fortune of getting to know many of the fine people that work at QlikTech.  As both a customer and partner I have also been a champion of QlikView and the basic principles that differentiate the product in the BI marketplace.


I now have a great opportunity as B&D has given me the stage in which to share this passion with the market by explaining what I have come to take for granted when it comes to analytics.  BI can be agile, flexible, fast, and spontaneous but still be properly governed and compliant within enterprise standards by a properly designed QlikView solution.


I will use this forum to share my thoughts on what differentiates QlikView and B&D - making our partnership a very compelling story when it comes to solving the BI needs of the enterprise.


-emb